CAT Questions | CAT LR DI
CAT DILR | CAT Previous year questions
 CAT Questions
CAT DI LR section has become increasingly tough beginning from 2015. However, Understanding the basics of Bar graphs, Pie Charts, Multiple graphs, Line Graphs etc forms an integral part of solving tougher CAT level DI LR questions for the CAT Exam. This question is from CAT 2017 Slot 1 CAT DILR.
CAT DILR : 2017 slot 1 questions
Simple Happiness Index
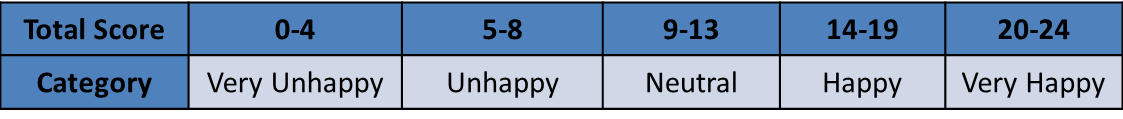
Simple Happiness index (SHI) of a country is computed on the basis of three parameters: social support (S), freedom to life choices (F) and corruption perception (C). Each of these three parameters is measured on a scale of 0 to 8 (integers only). A country is then categorized based on the total score obtained by summing the scores of ail the three parameters, as shown in the following table:
Following diagram depicts the frequency distribution of the scores in S, F and C of 10 countries - Amda, Benga, Calla, Delma, Eppa, Varsa, Wanna, Xanda, Yanga and Zooma:
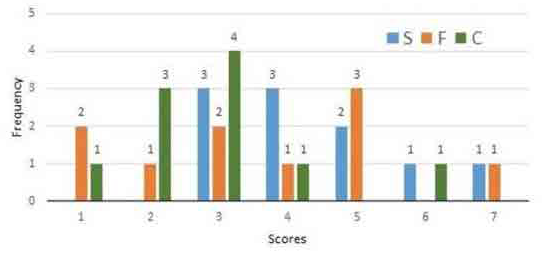
Further, the following are known:
1.Amda and Calla jointly have the lowest total score, 7, with identical scores in all the three parameters.
2.Zooma has a total score of 17.
3.All the 3 countries, which categorised as happy, have the highest score in exactly one parameter.
Question 3: Benga and Delma, two countries categorized as happy, are tied with the same total score. What is the maximum score they can have?
- 14
- 15
- 16
- 17
Video Explanation
Best CAT Coaching in Chennai
CAT Coaching in Chennai - CAT 2022
Limited Seats Available - Register Now!
Explanatory Answer
Method of solving this Question on CAT DILR
General Solution
Some simple inferences
1. No one has got any 8 or 0.
2. Score of 3 is the most frequent, scores of 4 and 5 come right after that.
Now, let us look at some of the constraints
Total adding up to 7 – this can be {1, 1, 5}, {1, 2, 4}, (1, 3, 3), {2, 2, 3} in some order.
A and C get identical scores. So, if one gets {1, 1, 5}, the other also should have got {1, 1, 5}.
We do not even have four 1’s, so {1, 1, 5} is ruled out.
We have 1 two from F, and 3 twos from C. So, we cannot have {2, 2, 3} either. Both A and C could have got a 2 with C, but they both could not have gotten a score of 2 with F.
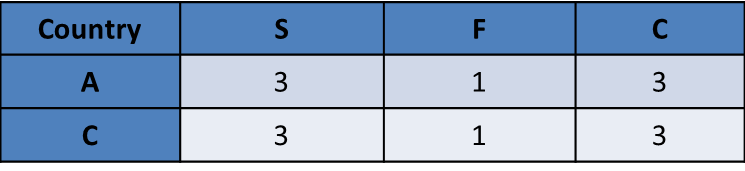
Both {1, 2, 4} and {1, 3, 3} are possible.
Only F = 1 is possible. Only C = 2 is possible. So, more specifically, we have two possibilities

Total adding up to 17 – this can be {7, 6, 4}, {7, 5, 5} or {6, 6, 5} in some order.
Z cannot be {7, 5, 5}.
Why not? Think about this
Only S and F have scores of 7 and 5. There is no C score or 7 or 5. So, Z has to be either {7, 6, 4} or {6, 6, 5}.
Z has to be either {7, 6, 4} or {6, 6, 5}. One Country should have scored highest in S, one in F and one in C. All three totals add up to 14 or more.
Let us call the three as happy Countries as Z, T1, T2 and build possible scenarios.
Let us start with Z = {7, 6, 4}. In this case, Z should have scored the highest in S or F. So some other Country should have scored the highest in C. So, some other Country gets C = 6, Z should get S = 6. So, Z should have got F = 7
Let us start with Z = {7, 6, 4}. In this case, Z should have scored the highest in S or F. So some other Country should have scored the highest in C. So, some other Country gets C = 6, Z should get S = 6. So, Z should have got F = 7. T1 should have S = 7, and T2 should have C = 6
Alternatively Z = {6, 6, 5}. In this case, Z should have scored the highest in C. So the other two Countries should have scored the highest in S and F. Both these tables appear possible.
Incorporating all possibilities
We have only two ways of getting to 17 {7, 6, 4} and {6, 6, 5} and only one way each of getting each of these combinations. So, three Countries could not have scored 17. Now, let us see if we can get B and D to a total of 16. If we get that, then this max score is possible.
Let us try with Z = {6, 5, 6}. T1 should have F + C adding up to 9 and T2 should have S + C adding up to 9. Is this possible? We are out of 7’s and 6’s. So, we can get to 9 only by adding and 5 and 4. We have only one C = 4, so this is not possible. Let us try the other combination.
Let us try with Z = {6, 7, 4}. T1 should have F + C adding up to 9 and T2 should have S + F adding up to 10. Is this possible? We are out of 7’s and 6’s. So, we can get to 10 only by adding and 5 and 5. We can get 9 only with a 5 + 4. let us if this fits in properly
We have only one C = 4, so this is not possible. Now, let us go for the maximum possible total being 15 for both.
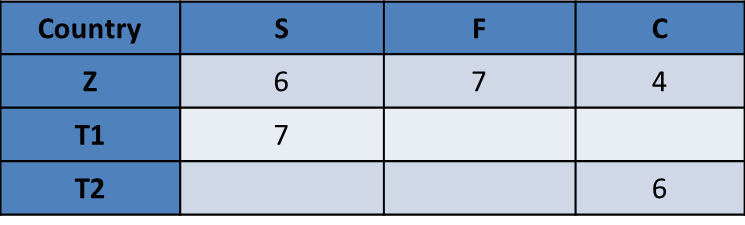
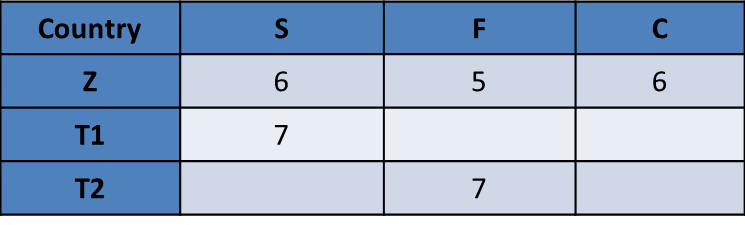
Let us try with Z = {6, 5, 6}. T1 should have F + C adding up to 8 and T2 should have S + C adding up to 8. Is this possible? We are out of 7’s and 6’s. 8 can be a 4 + 4 or as 5 + 3. Is this possible?
The below grid appears possible. So, the maximum could be 15.
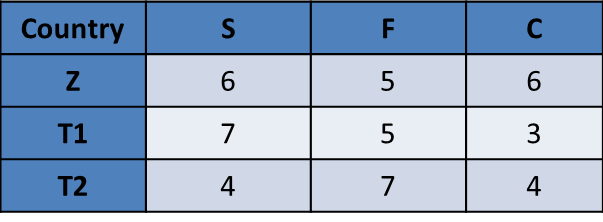
The question is "Benga and Delma, two countries categorized as happy, are tied with the same total score. What is the maximum score they can have?"
Hence, the answer is "15".
Choice B is the correct answer.

CAT Preparation Online | Logical Reasoning for CAT questions Videos On YouTube
CAT Preparation Online | Data Interpretation for CAT questions Videos On YouTube

CAT Questions | CAT Quantitative Aptitude
CAT Questions | CAT DILR
CAT Questions | Verbal Ability for CAT
Copyrights © All Rights Reserved by 2IIM.com - A Fermat Education Initiative.
Privacy Policy | Terms & Conditions
CAT® (Common Admission Test) is a registered trademark of the Indian
Institutes of Management. This website is not endorsed or approved by IIMs.
Where is 2IIM located?
2IIM Online CAT Coaching
A Fermat Education Initiative,
19/43, MG Chakrapani St,
Sathya Garden, Saligramam, Chennai 600 093
How to reach 2IIM?
Mobile: (91) 99626 48484
WhatsApp: WhatsApp Now
Email: info@2iim.com