CAT Questions | CAT LR DI
Data Interpretation for CAT | DI: Bar Graphs
CAT DI LR section has become increasingly tough beginning from 2015. However, Understanding the basics of Bar graphs, Pie Charts, Multiple graphs, Line Graphs etc forms an integral part of solving tougher CAT level DI LR questions for the CAT Exam. Make use of 2IIMs Free CAT Questions, provided with detailed solutions and Video explanations to obtain a wonderful CAT score. If you would like to take these questions as a Quiz, head on here to take these questions in a test format, absolutely free.
Data Interpretation for CAT: Stacked Bar Graphs
The following chart gives the revenue share of different companies in the tech sector in Cuckooland:

-
CAT LR DI Bar Graphs
In 2001, the company that grew the quickest grew by 100%, what was the growth rate of the company that had the least growth rate?
-
CAT LR DI Bar Graphs
In 2002, the growth rate of the overall sector was 39%, what was the growth rate seen by SCT?
-
CAT LR DI Bar Graphs
Total revenue in 2006 was $21.2 bn, total revenue in 2005 was $18.1 bn. What was the growth rate seen in Centure?
-
CAT LR DI Bar Graphs
In 2004, the entire industry added $4bn, of which an increase of $1bn was contributed by COGN, what was the growth rate seen by the entire sector in 2004?
The Questions that follow, are from actual XAT papers. If you wish to take them separately or plan to solve actual XAT papers at a later point in time, It would be a good idea to stop here.
XAT 2020 Question Paper - QADI
Read the information given below and answer the 3 associated questions.
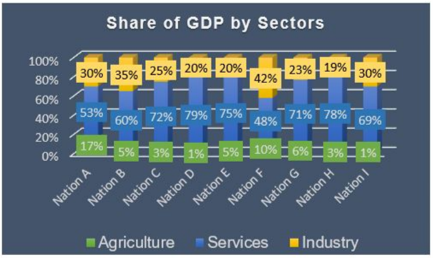
The following graph depicts sector-wise percentage contributions to the gross domestic product (GDP) of nine nations, labelled "Nation A", "Nation B" and so on. It is known that these nations are Brazil, China, France, Germany, India, Japan, Russia, the UK and the USA, but not necessarily in the same order.
The following, however, are known:
i)The GDPs of the nine nations (in US$ trillion) are:Nation Brazil China France Germany Japan India Russia UK USA GDP 2 10 3 4 5 2 2 3 17 ii)China has the highest agriculture sector GDP, valued at US $1 trillion, followed respectively by the USA and India
iii)In terms of percentage contribution to the respective nations' GDPs by their service sectors, the UK and France are respectively the first and the second
iv)Nation A, Nation B and Nation G have the same GDP
v)The GDP of India's industry sector is lower than the GDP of Russia's industry sector. However, it is larger than that of Brazil's industry sectorBased on the given information, how many nations can be uniquely identified?
- 3
- 7
- 9
- 6
- 2
Choice D
6XAT 2020 Question Paper - QADI
Based on the given information, which of the following CANNOT be ruled out?
- Russia is Nation G
- Japan is Nation E
- US is Nation I
- India is Nation B
- China is Nation C
Choice B
Japan is Nation EXAT 2020 Question Paper - QADI
Which of the following information, when considered in addition to the given information, does not allow us to completely identify the nine nations in the graph?
- Both Japan’s and Germany’s industry GDPs are more than US $1 trillion
- Germany’s industry GDP is US $1.2 trillion
- Japan’s industry GDP is US $1.25 trillion
- In terms of percentage contribution to the respective nations’ GDP, France and Japan’s agriculture sectors contribute the same
- The nation ranked fourth in terms of agriculture GDP has its agriculture GDP valued at US $150 billion
Choice B
Germany’s industry GDP is US $1.2 trillion
The Questions that follow, are from actual IPMAT papers. If you wish to take them separately or plan to solve actual IPMAT papers at a later point in time, It would be a good idea to stop here.
IPMAT 2019 Question Paper - IPM Indore Quants
Analyze the given data for exports and imports of rubber in Rs. crores from 2016 to 2017 and answer the questions based on the analysis.
Average annual exports for the given period 2006-2017) was approximately
IPMAT 2019 Question Paper - IPM Indore Quants
The percentage decline in exports during the period 2006-2011 is more than the percentage decline in exports during 2012-2017 by approximately
IPMAT 2019 Question Paper - IPM Indore Quants
The maximum difference between imports and exports is
IPMAT 2019 Question Paper - IPM Indore Quants
Balance of trade is defined as imports subtracted from exports ( = exports - imports). Which of the following blocks of three years has witnessed the largest average negative balance of trade?
IPMAT 2019 Question Paper - IPM Indore Quants
The percentage increase in imports over the previous year is maximum during
CAT Preparation Online | Data Interpretation for CAT questions Videos On YouTube
CAT Preparation Online | Logical Reasoning for CAT questions Videos On YouTube
CAT Questions | CAT Quantitative Aptitude
CAT Questions | CAT DILR
CAT Questions | Verbal Ability for CAT
Copyrights © All Rights Reserved by 2IIM.com - A Fermat Education Initiative.
Privacy Policy | Terms & Conditions
CAT® (Common Admission Test) is a registered trademark of the Indian
Institutes of Management. This website is not endorsed or approved by IIMs.
Where is 2IIM located?
2IIM Online CAT Coaching
A Fermat Education Initiative,
58/16, Indira Gandhi
Street,
Kaveri Rangan Nagar, Saligramam, Chennai 600 093
How to reach 2IIM?
Phone: (91) 44 4505 8484
Mobile: (91) 99626 48484
WhatsApp: WhatsApp Now
Email: prep@2iim.com


