CAT Questions | CAT LR DI
Data Interpretation for CAT | DI: Multiple Graphs
CAT DI LR section has become increasingly tough beginning from 2015. However, Understanding the basics of Bar graphs, Pie Charts, Multiple graphs, Line Graphs etc forms an integral part of solving tougher CAT level DI LR questions for the CAT Exam. Make use of 2IIMs Free CAT Questions, provided with detailed solutions and Video explanations to obtain a wonderful CAT score. If you would like to take these questions as a Quiz, head on here to take these questions in a test format, absolutely free.
Data Interpretation for CAT: Multiple Graphs
Revenue Breakup of Godliness Inc.
Godliness Inc, a religious firm run by good Samaritans likes to plant clues about its revenue numbers so that its employees get a near spiritual aha moment while uncovering them.
The company has 5 divisions P, Q, R, S and T. The year 2012 was declared the year of Satan as the company saw a revenue decline of 2.727% in that year. Apart from this year, the company saw a good half-decade from 2010 to 2014.
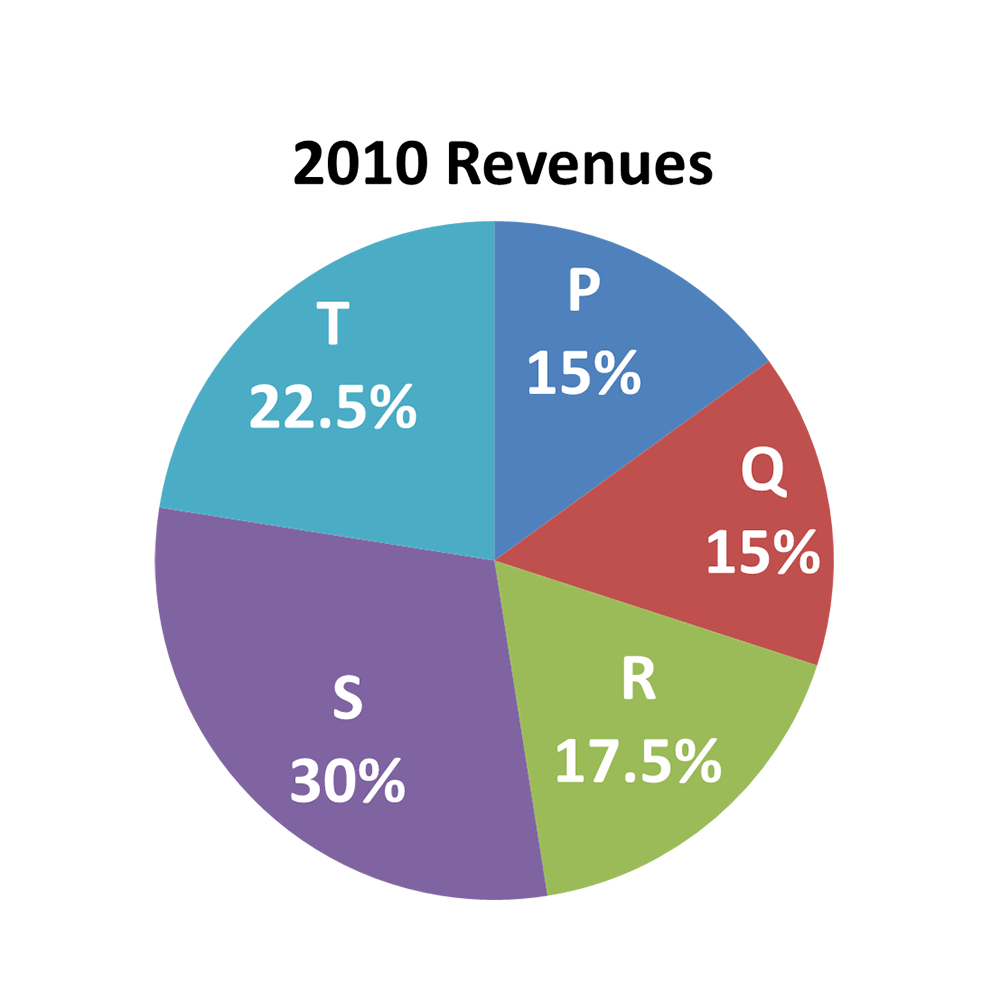
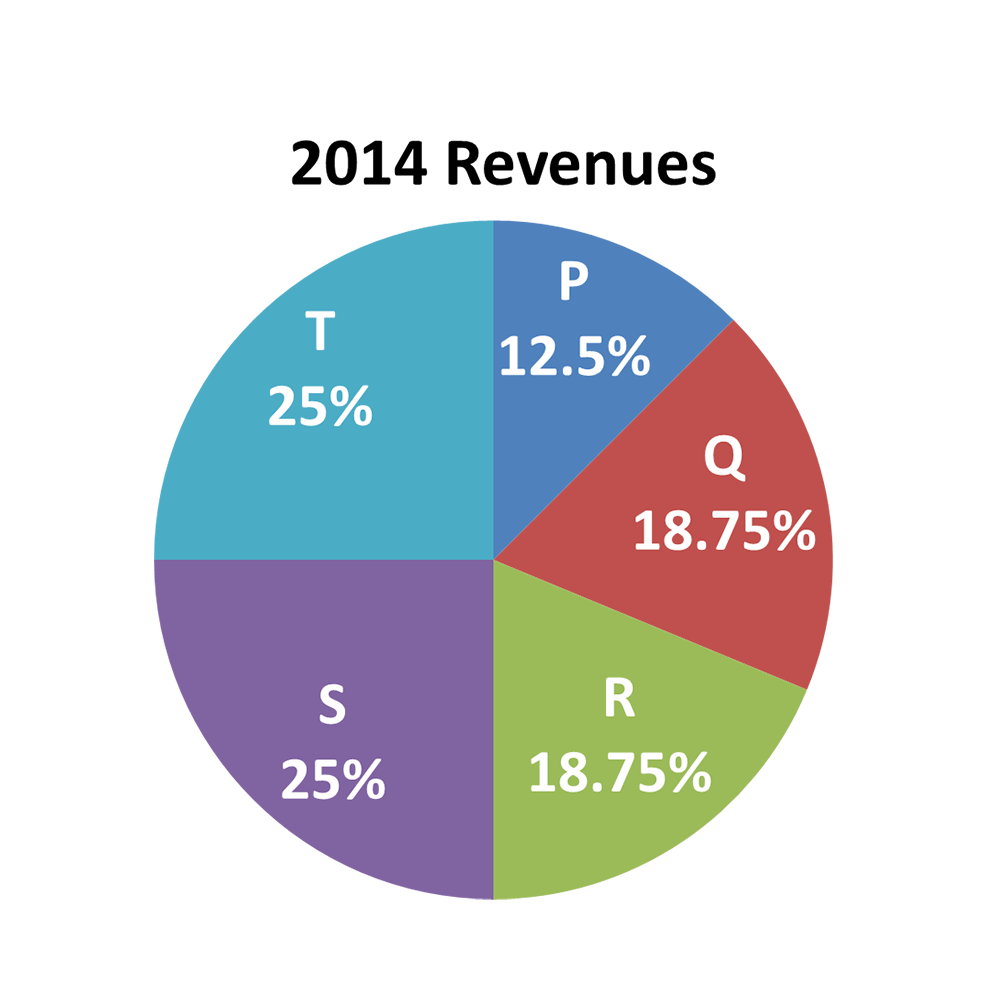
The 2010 and 2014 revenue break-ups are as follows. Total revenues in 2010 was Rs. 1000 crores and the company saw a 28% growth in revenue over the period from 2010 to 2014.
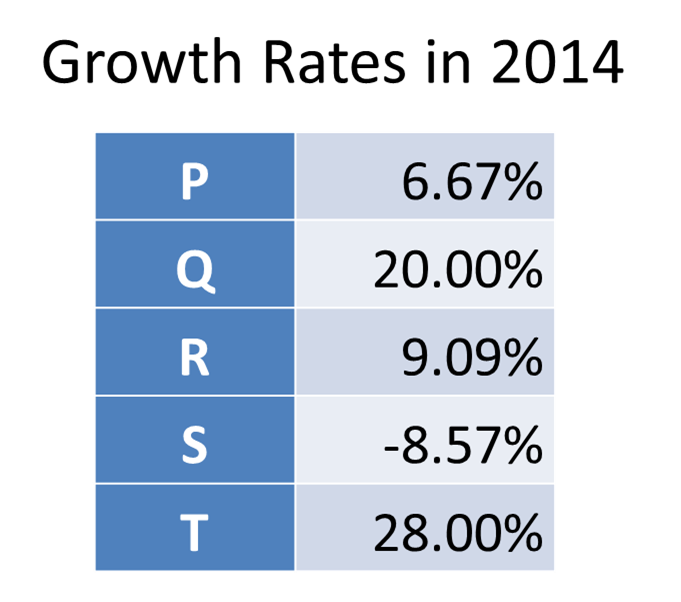
The yoy growth rates seen in 2014 are given in the table below
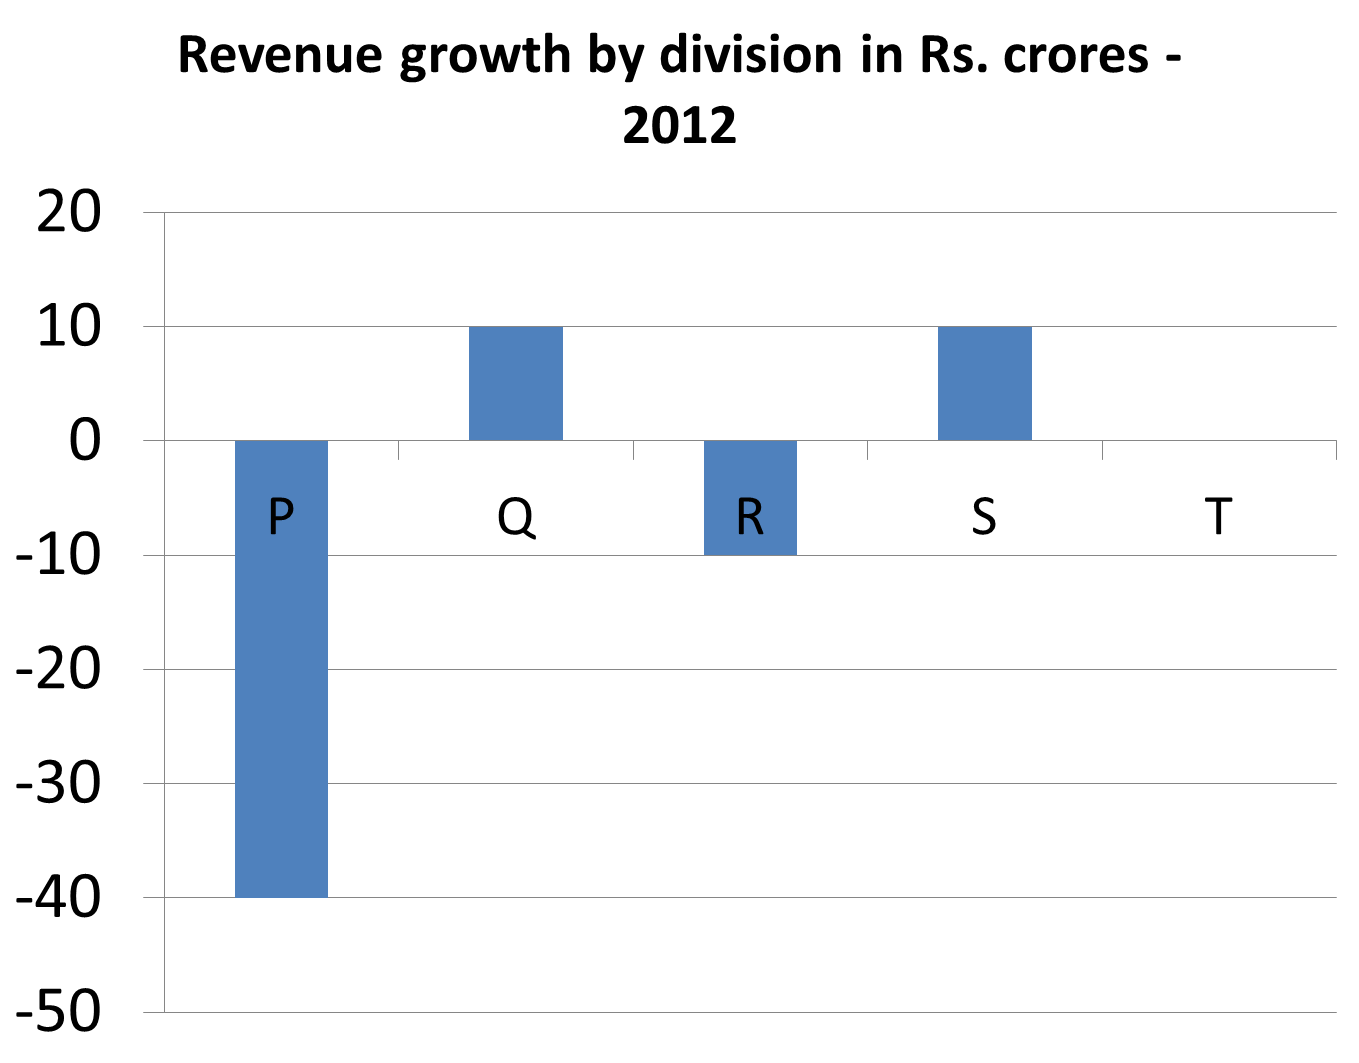
The revenue numbers added per division in 2012 are given in the chart shown below
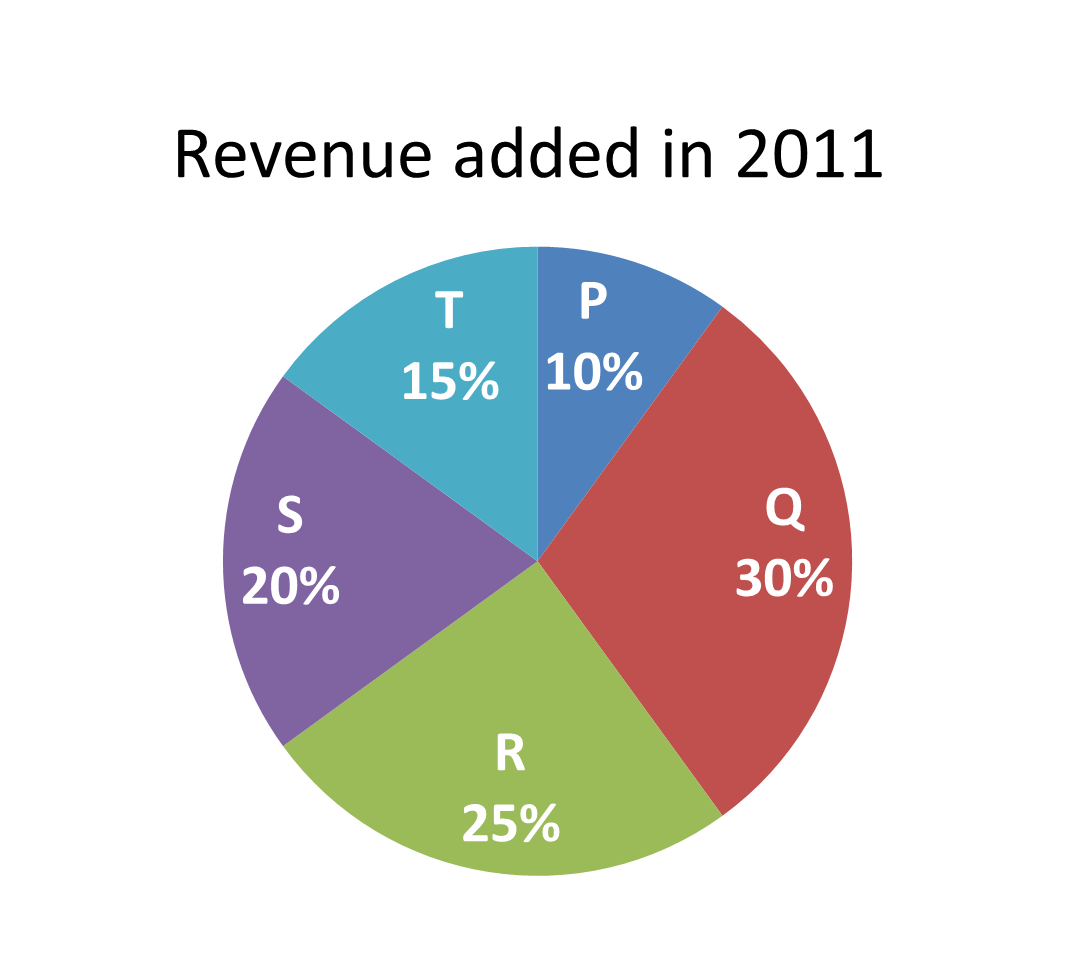
The break-up of revenues added in 2011 are as shown below. Note that this pie chart gives the break-up of the total revenues ADDED in the year 2011 and not the total revenues of the year 2011. This merely charts the increments.
-
CAT LR DI Multiple Graphs
What was the total revenue in Rs. crores in 2012?
-
CAT LR DI Multiple Graphs
Which year saw the highest percentage growth in revenues?
-
CAT LR DI Multiple Graphs
What were the revenues in in Rs. Crores division Q in 2011?
-
CAT LR DI Multiple Graphs
What were the revenues in in Rs. Crores division R in 2012?
-
CAT LR DI Multiple Graphs
How many crores of revenues did division T add in the year 2013?
The Questions that follow, are from actual XAT papers. If you wish to take them separately or plan to solve actual XAT papers at a later point in time, It would be a good idea to stop here.
XAT 2018 Question Paper - QADI
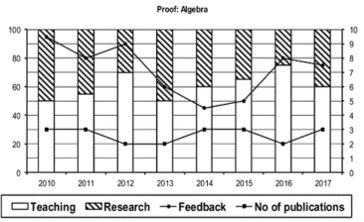
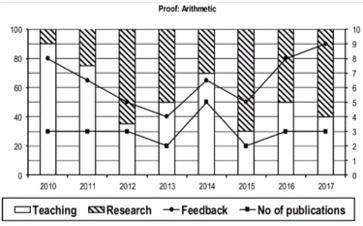
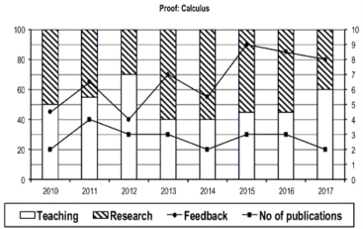
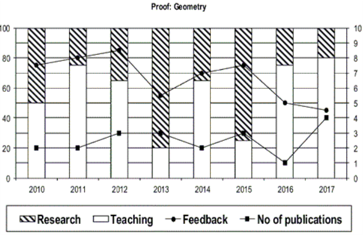
The graphs below represent the performance of four professors, across years, measured on four variables: Percentage of time spent on teaching, percentage of time spent on research, feedback (on a scale of 10, right-hand side) and number of publications (right-hand side). Assume that the cumulative time spent per year on research and teaching activities are same for all four professors and each of them taught only one course of 90 classroom hours.
Which of the following, shows the maximum year to year percentage growth in feedback?
- Professor Arithmetic during 2013-2014
- Professor Algebra during 2015-2016
- Professor Calculus during 2012-2013
- Professor Calculus during 2014-2015
- None of the above
Choice C
Professor Calculus during 2012-2013XAT 2018 Question Paper - QADI
Count the number of instances in which "annual decreasing efforts in research" is accompanied with "annual increase in feedback"?
- 5
- 7
- 9
- 11
- None of the above.
Choice C
9XAT 2018 Question Paper - QADI
Research efficiency is the ratio of cumulative number of publication for a period of 3 years to the cumulative number of hours spent on research activity in those 3 years. Which of the following professors is the least efficient researcher for the period 2015 to 2017?
- Professor Arithmetic
- Professor Algebra
- Professor Geometry
- Professor Calculus
- Cannot be determined as research is expressed in percentage
Choice A
Professor Arithmetic
CAT Preparation Online | Data Interpretation for CAT questions Videos On YouTube
CAT Preparation Online | Logical Reasoning for CAT questions Videos On YouTube


CAT Questions | CAT Quantitative Aptitude
CAT Questions | CAT DILR
CAT Questions | Verbal Ability for CAT
Copyrights © All Rights Reserved by 2IIM.com - A Fermat Education Initiative.
Privacy Policy | Terms & Conditions
CAT® (Common Admission Test) is a registered trademark of the Indian
Institutes of Management. This website is not endorsed or approved by IIMs.
Where is 2IIM located?
2IIM Online CAT Coaching
A Fermat Education Initiative,
58/16, Indira Gandhi
Street,
Kaveri Rangan Nagar, Saligramam, Chennai 600 093
How to reach 2IIM?
Phone: (91) 44 4505 8484
Mobile: (91) 99626 48484
WhatsApp: WhatsApp Now
Email: prep@2iim.com