CAT Questions | CAT LR DI
Data Interpretation for CAT | DI: Bar Graphs
 CAT Questions
CAT DI LR section has become increasingly tough beginning from 2015. However, Understanding the basics of Bar graphs, Pie Charts, Multiple graphs, Line Graphs etc forms an integral part of solving tougher CAT level DI LR questions for the CAT Exam. This question is from DATA Interpretation for CAT - Bar Graphs.
DI Bar Graphs: Stacked Bar Graphs
The following chart gives the revenue share of different companies in the tech sector in Cuckooland. :
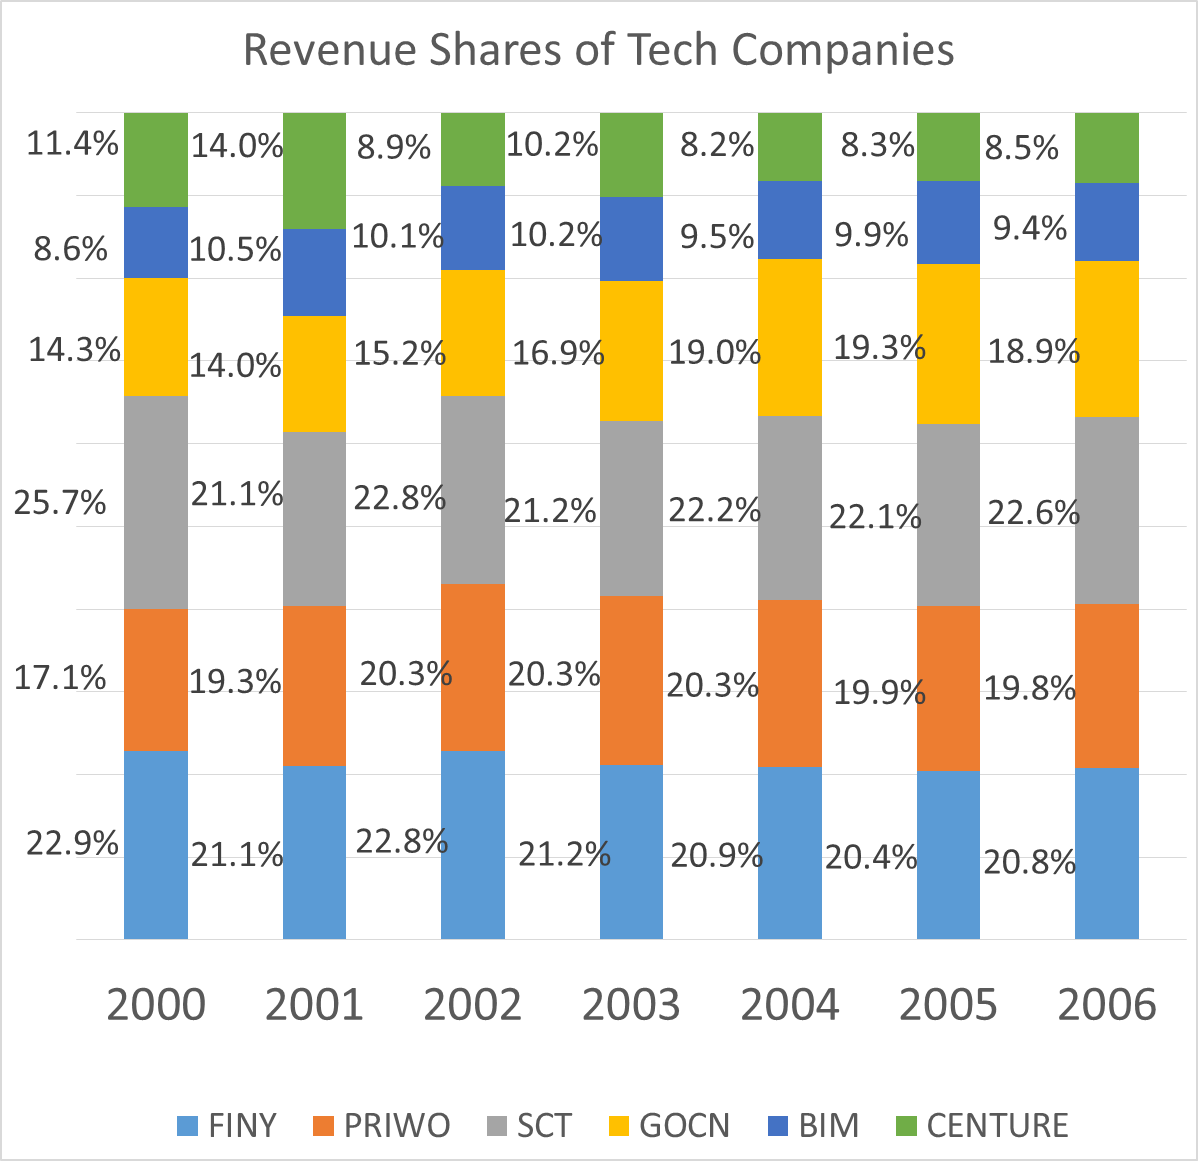
Question 1: In 2001, the company that grew the quickest grew by 100%, what was the growth rate of the company that had the least growth rate?
- 50%
- 25%
- 20%
- 33%
Best CAT Online Coaching
Try upto 40 hours for free
Learn from the best!
2IIM : Best Online CAT Coaching.
Video Explanation
Best CAT Coaching in Chennai
CAT Coaching in Chennai - CAT 2022
Limited Seats Available - Register Now!
Explanatory Answer
Method of solving this Question on Data Interpretation for CAT
Note that we can answer this question even if we do not know the overall numbers in 2000 and 2001. Let the total revenues of the entire industry be X in 2000 and Y in 2001.
FINY has grown from 22.9% of X to 21.1% of Y, which is nothing but \\frac{21.1}{22.9}\\)% * \\frac{Y}{X}\\)-1 expressed as a percentage.
Likewise, growth of PRIWO would be \\frac{19.3}{17.1}\\)% * \\frac{Y}{X}\\)-1. And so on for the rest.
So the company that grew the quickest would be the one that had the maximum ration of 2001 revenue share to 2000 revenue share. Only the shares matter, X's and Y's do not matter.
So, to find the company that grew quickest, all we need to do is find the highest of \\frac{21.1}{22.9}\\), \\frac{19.3}{17.1}\\), \\frac{21.1}{25.7}\\), \\frac{14}{14.31}\\),\\frac{10.5}{8.6}\\),\\frac{14}{11.4}\\). Of these \\frac{14}{11.4}\\) is the highest.
Now, we know that CENTURE saw the highest growth and that this growth number was 100%. Or, CENTURE saw its revenues double.
Or 14% of Y = 11.4% of X * 2 Or \\frac{Y}{X}\\) = \\frac{2x11.4}{14}\\) = 1.629
To find out the company that saw the least growth rate, we need to find the least among the listed fractions. Or the least among \\frac{21.1}{22.9}\\), \\frac{21.1}{25.7}\\), and \\frac{14}{14.31}\\). This is clearly \\frac{21.1}{25.7}\\).
Or, the company that saw the least growth rate is SCT.
SCT's growth rate is \\frac{21.1}{25.7}\\)% * \\frac{Y}{X}\\)-1. Or \\frac{21.1}{25.7}\\) x 1.629 = 0.33.
Or, SCT grew by 33%.
The question is "growth rate of the company that had the least growth rate?"
Hence, the answer is "33%".
Choice D is the correct answer.
In stacked bar charts (and pie charts) the relative shares very often underpin the more important ideas. A bunch of key pointers –
1. For measuring which component has growth the maximum and minimum, actual numbers are not required.
2. We need actual numbers only to measure actual growth rates.
3. A company that has seen its share shrink could also have seen actual growth (like SCT above) and vice versa.
4. If we know overall growth rate from one year to another, we can compute individual growth rates

CAT Coaching in Chennai
CAT 2024
Classroom Batches Starting Now! @Gopalapuram and @Anna nagar
CAT Preparation Online | Data Interpretation for CAT questions Videos On YouTube
CAT Preparation Online | Logical Reasoning for CAT questions Videos On YouTube


CAT Questions | CAT Quantitative Aptitude
CAT Questions | CAT DILR
CAT Questions | Verbal Ability for CAT
Copyrights © All Rights Reserved by 2IIM.com - A Fermat Education Initiative.
Privacy Policy | Terms & Conditions
CAT® (Common Admission Test) is a registered trademark of the Indian Institutes of Management. This website is not endorsed or approved by IIMs.
Where is 2IIM located?
2IIM Online CAT Coaching
A Fermat Education Initiative,
58/16, Indira Gandhi Street,
Kaveri Rangan Nagar, Saligramam, Chennai 600 093
How to reach 2IIM?
Phone: (91) 44 4505 8484
Mobile: (91) 99626 48484
WhatsApp: WhatsApp Now
Email: prep@2iim.com